
Results Instructions
The results portal consists of three sections that allow users to create peer comparisons, build custom reports, and view national reports. If you are only interested in reviewing the national benchmarks (variables), please skip down and review that section of the instructions first. For most users, it might make sense to start by creating a peer group first, and then conduct peer comparisons.
Peer Comparison Reports
Peer comparisons are different than peer groups, although the two are not necessarily mutually exclusive. The peer comparison tool (found under the "Peer Comparison" menu under the "Results" tab), allows the users to select users based upon a variety of selected criteria. Before conducting peer comparisons you will first need to populate the peer institution field by creating at least one peer group. You can do so by clicking on “Manage your peer groups” at the bottom of the page.
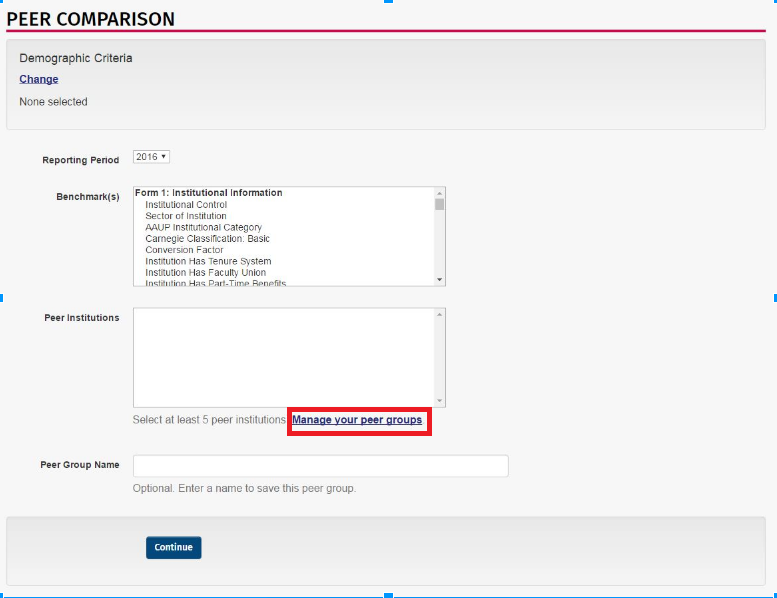
From this “Manage Peer Groups” overview, you can add, edit, or delete peer groups. To start, click “Add a peer group” and then assign a reference name for the peer group and then click “Save.” After you’re redirected back to the overview page, click the “edit” button. To add peers, we offer two choices:
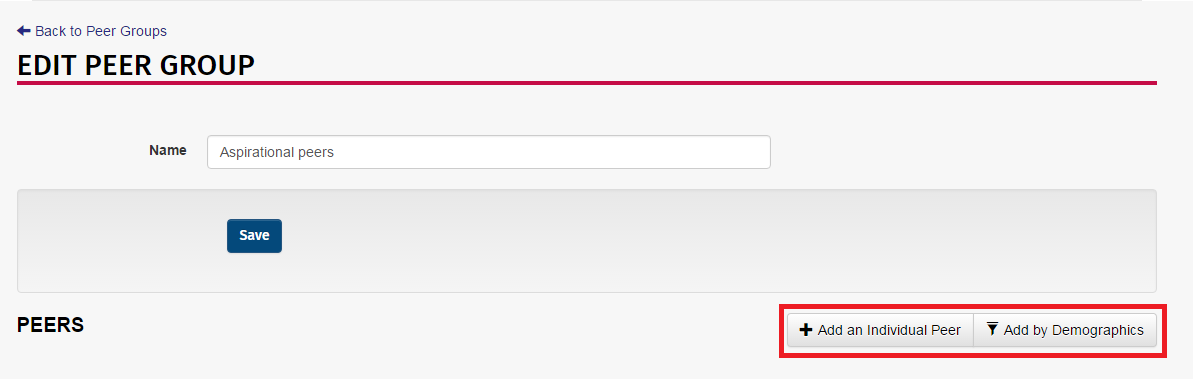
-
Individual Peer: If you want to add a specific school, clicking “Add an Individual Peer” will allow you to search and select peers one by one, either by scrolling down or by typing the name in and searching. You will need to click “save” after each. Once your peer list is completed, you can navigate back to the Peer Comparison page at https://research.aaup.org/reports/peer and continue reading the instructions below for “Using Benchmarks to Complete Custom Reports.”
-
Demographic Peer Comparison: This allows you to select a number of criteria to automatically generate a peer list. Click on each variable that you wish to include.
For instance, if you are trying to find all Public doctoral schools in the state of California, you would select “California” in State, “Public” in Institutional Control, and “Doctoral” in AAUP Institutional Category.
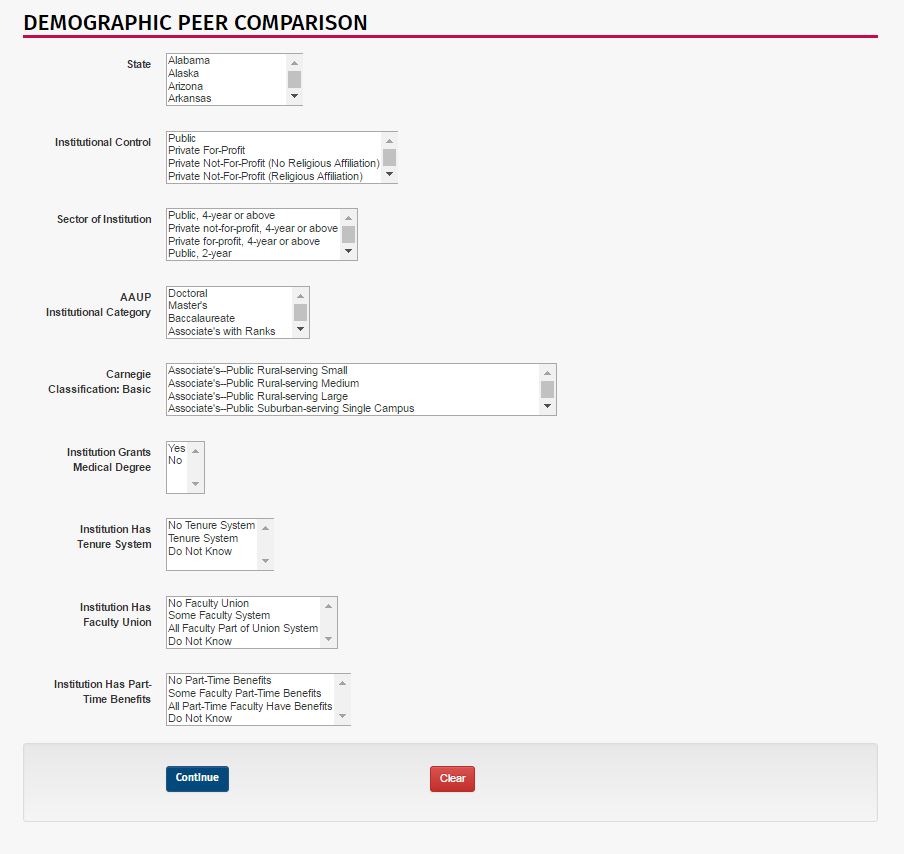
If you wish to select multiple metrics within a single field, you can do so by holding down the “Ctrl” key while clicking on each metric. This function enables you to include multiple states, categories, and controls in your peer list generator.
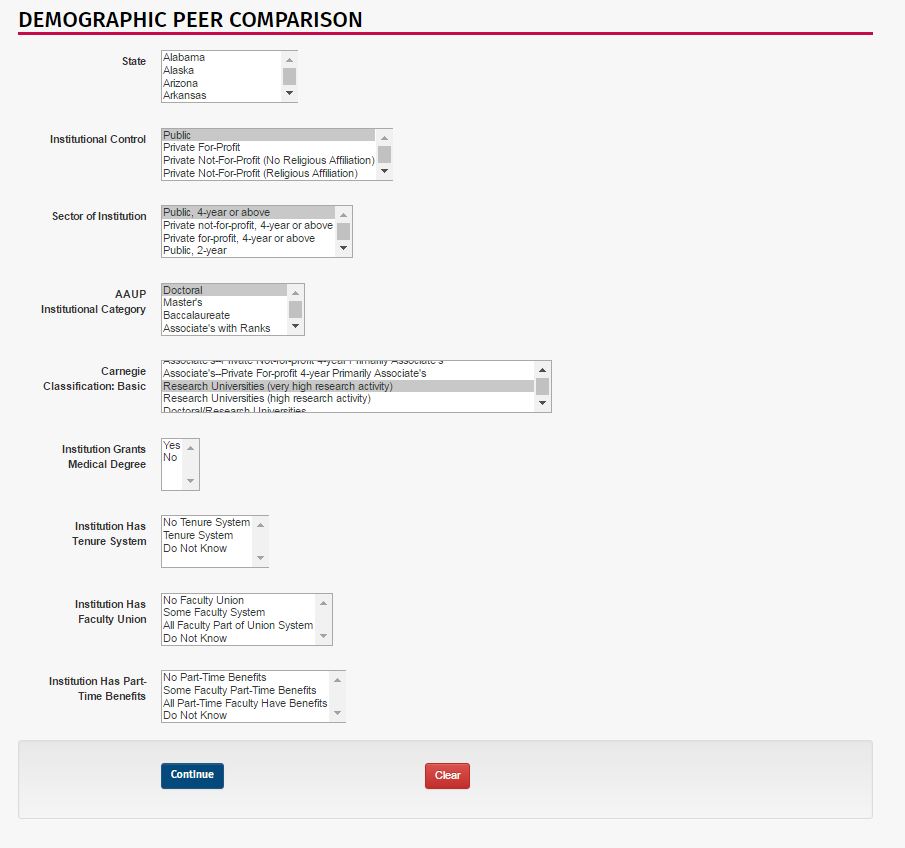
Once you click “continue,” you will have generated your demographic criteria and will be redirected to select your benchmarks.
Using Benchmarks to Create Comparison Reports
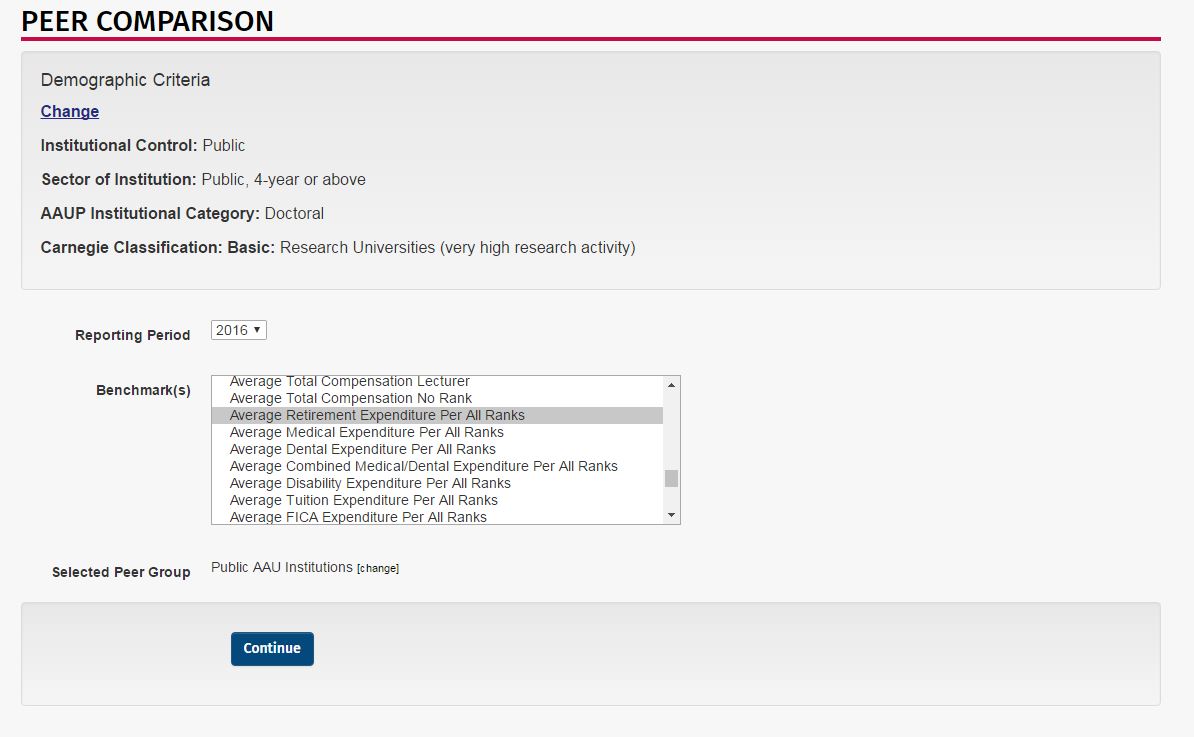
From here, you can choose the benchmarks that you will to use as a comparison. You may select multiple benchmarks by holding “Ctrl” as you click each one.
If you selected demographic criteria: That information will appear at the top of the page.
If you did not choose demographic criteria: You will simply select a benchmark and then any specific peer institution you wish to include.
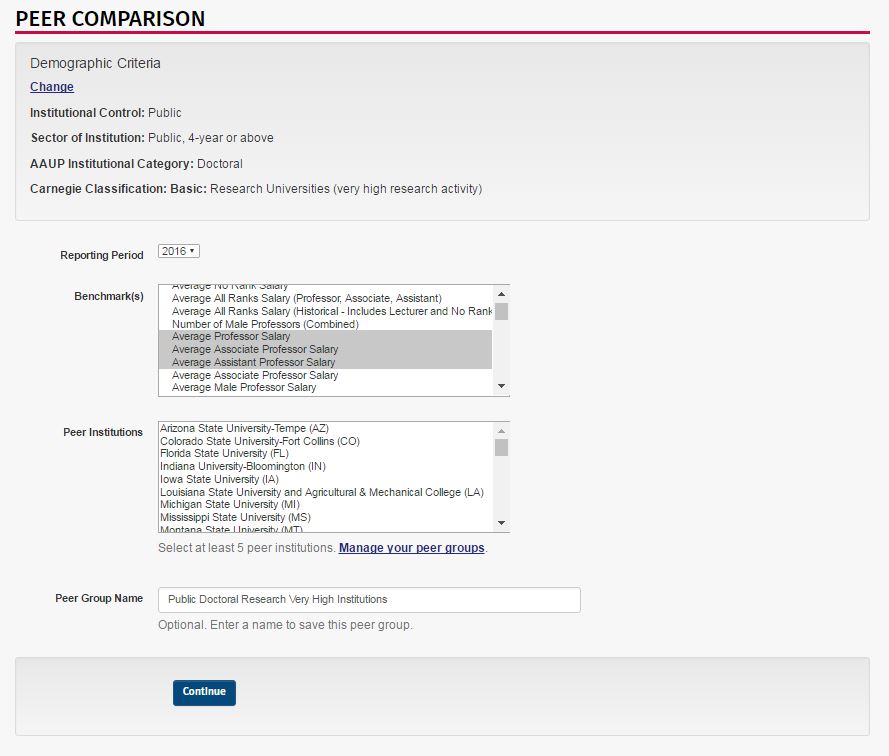
After choosing your benchmarks, you can click on your saved peer groups to automatically pull them up.
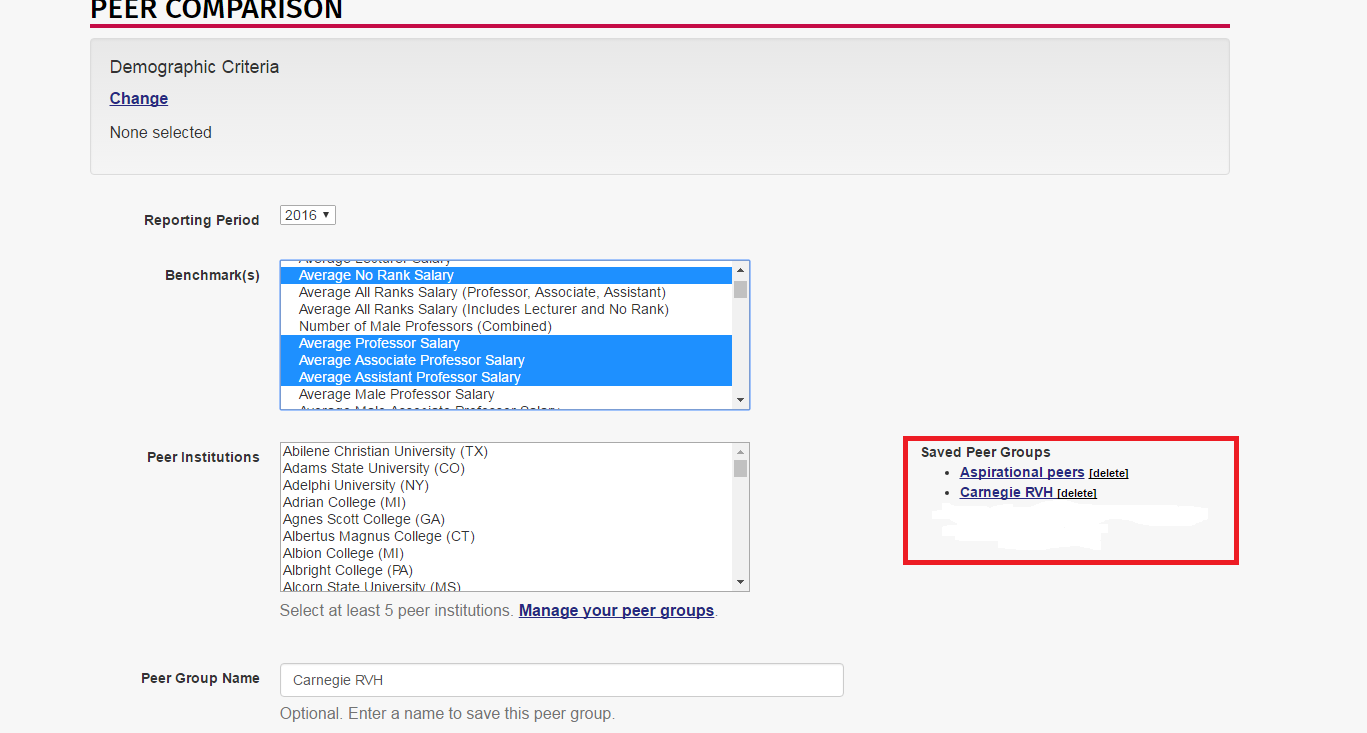
Your selected peer group should be listed at the bottom of the page. From here, you can simply select the benchmarks you wish to include and then click “continue.”
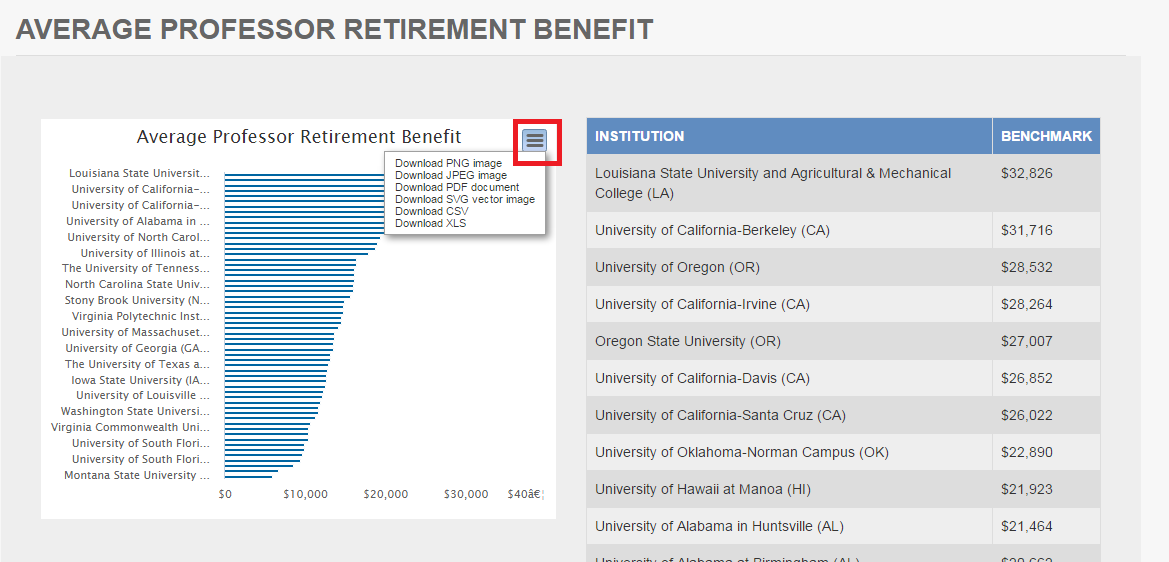
Your results will be displayed with a bar graph on the left and a spreadsheet style numerical list on the right. This data can be exported to numerous formats, including .csv and .xls, by clicking on the button in the top right corner of the bar graph.
Custom Reports
The custom reports tool allows users to build a custom data report using a variety of benchmarks, peer groups, and presentation formats. On the custom reports page, click “Add a Report” as shown below.

Fill in the report name and description fields and click “Save” to be taken to the custom report tool.

You may now view, edit, build, print, copy, or delete your report. To build a custom report, make sure the “Build” icon is selected and click “Add an Item.” Select an option from the drop-down menu to begin building a chart.

In this example, “Scatter Plot” has been selected. Fill in the title and select the year, x-axis, y-axis, and peer group of interest. Finally, click “Save” to complete your report. After the report has been created, you may make edits and download or print the report in a variety of formats.

National Report
When a user is logged in to the research portal, the national report page shows the user’s institution in comparison with national aggregated values for Forms 1-4. Users should select the year of interest and then scroll down the page or click the Download Report icon to see the comparison report. This report shows the institution’s reported value, the percent rank, sample size, and the national median percentiles. Click on the chart icon on the far right to see a bar chart for each benchmark. The bar charts can then be downloaded in a variety of formats or printed.